Problem: Visualize personal data taken over two weeks
My Solution: Collect data on my outfit habits and design my closet with the items to show the frequency!
Because I am a fashion addict, I thought it would be fitting to study which clothing and accessory items I wear within a two week period.
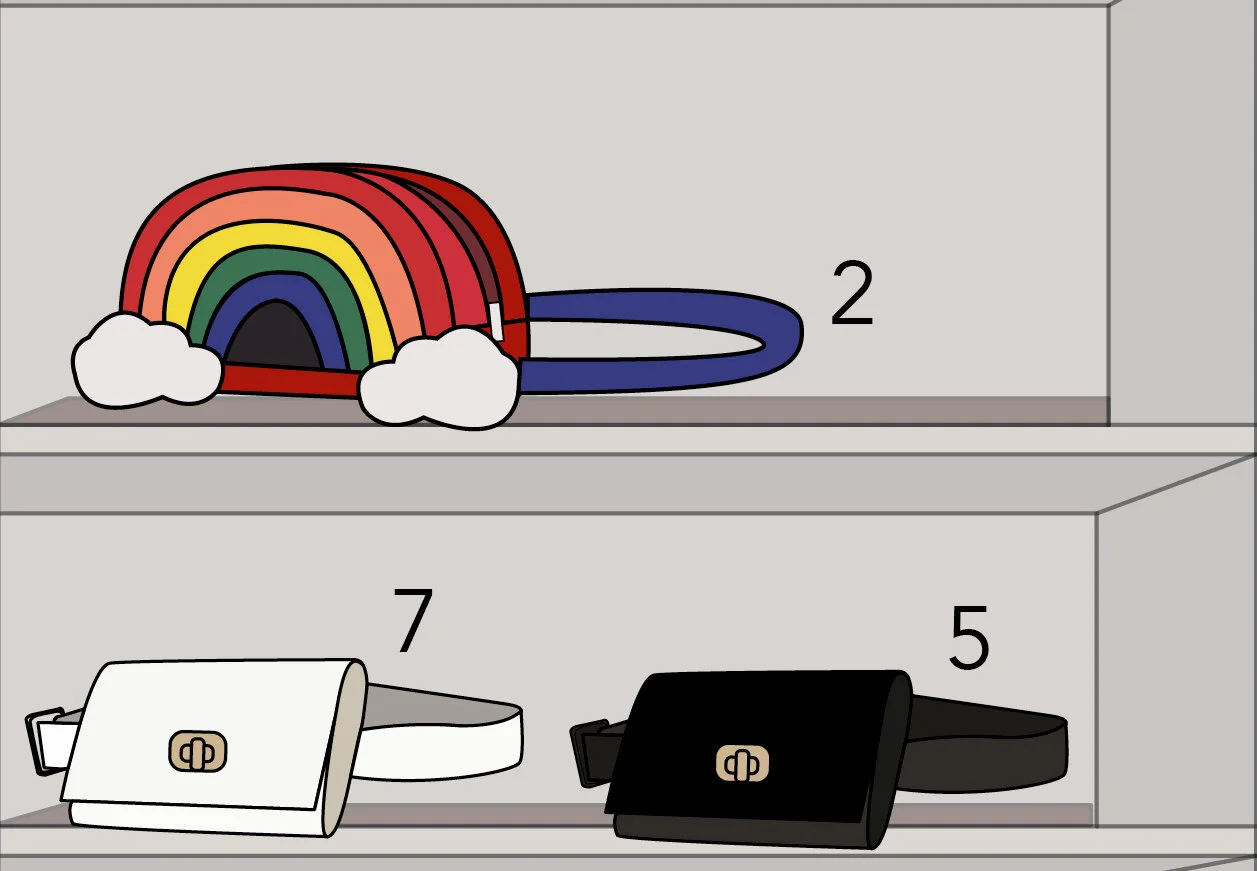
To visualize this data, I illustrated my (dream) closet, filled with all of my worn items from the 14 days, and added in the number for how many times I wore them!
I thought adding some personal elements, like my cheezits, Nature Valley granola bars, and my Crosley record player would enhance the visualization and make it feel more authentic to me!


